
Up to 85% of people who need assistive technology in the WHO African Region go without.
Average saving for a rural user on each search.
Users in Zimbabwe alone by December 2022.
Southern African countries mapped by AT-Info-Map.
Why assistive technology access is out of reach
Only 15–25% of people who need assistive technology (AT) in the WHO African Region can get it. Many go without because they cannot find where to buy it.
Before AT-Info-Map, a person in a rural area could not check which supplier stocked a wheelchair, a hearing aid or crutches. The only way was to travel to a city, visit suppliers and compare prices on the spot.
Every trip cost bus fare, a bed, meals and time away from work or care.
- Wheelchairs
- Hearing aids
- Crutches
- Ramps
- Adaptive software
Source: World Health Organization Regional Office for Africa, 2021.
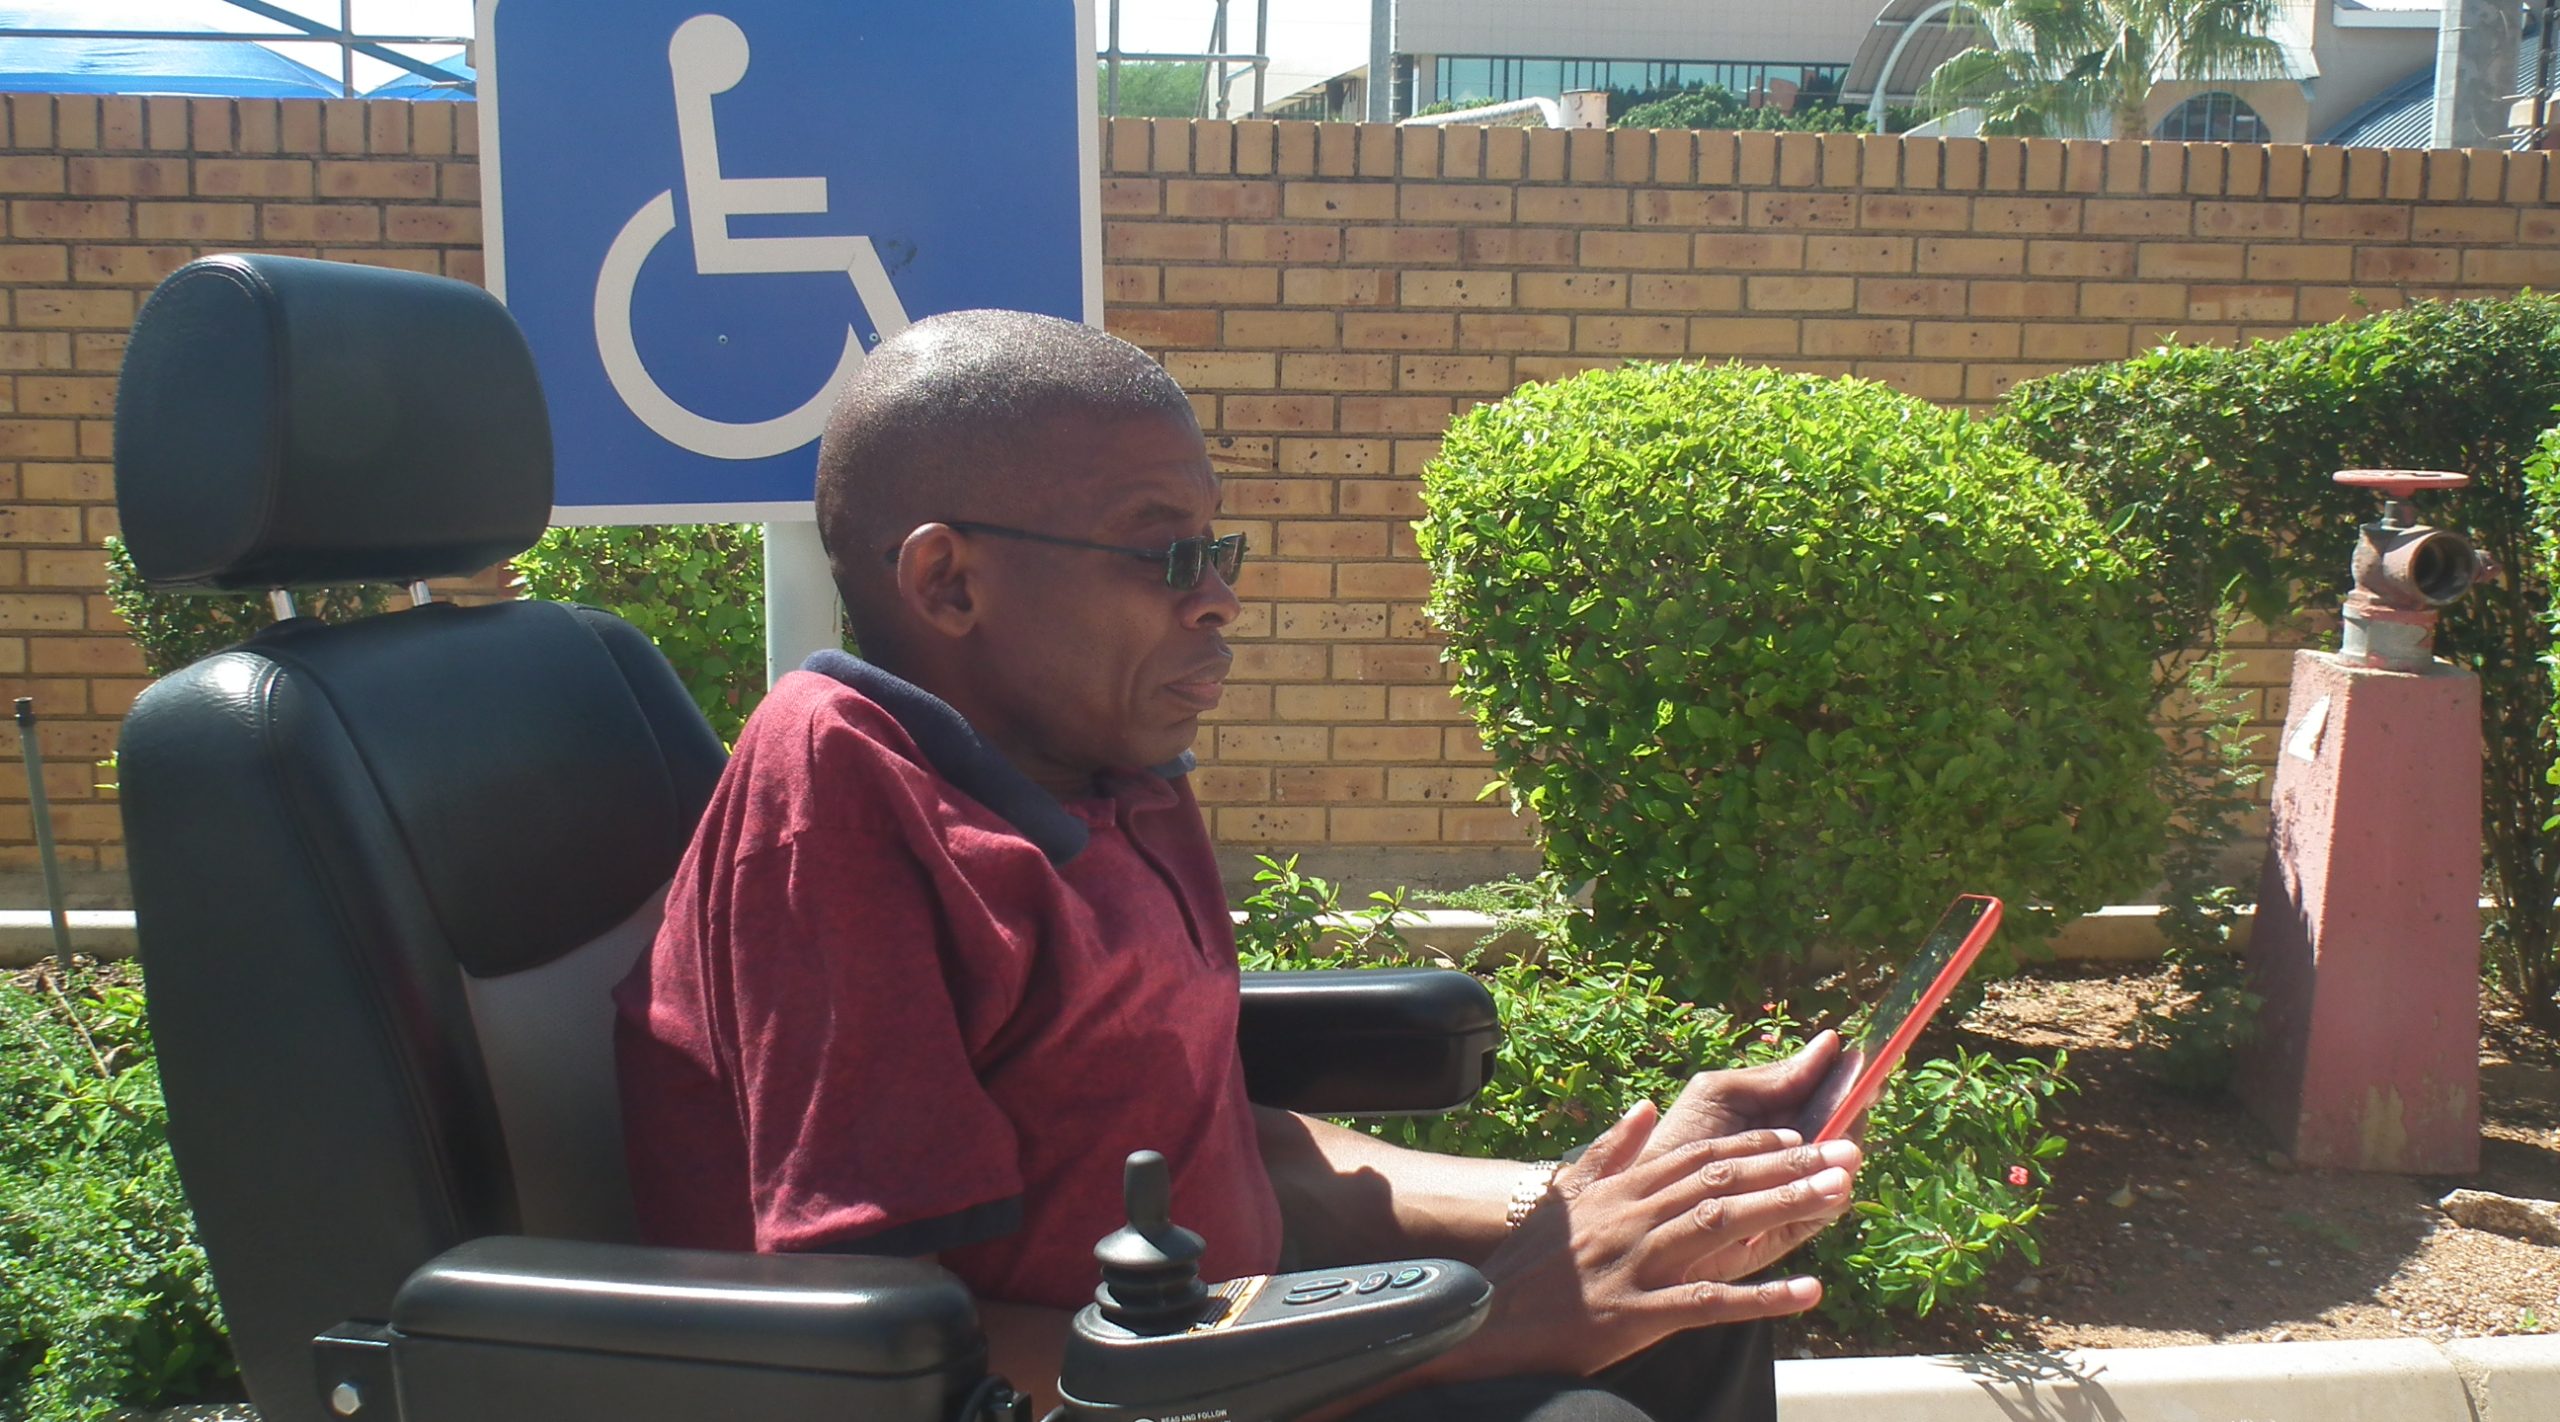
AT-Info-Map: find it, call it, then travel
From 2016 to 2019, SAFOD, the University of Washington and AfriNEAD built AT-Info-Map with a US$717,728 grant from Google.org. It is a mobile app and online database that improves assistive technology access by mapping AT suppliers in ten Southern African countries.
1. Search
Pick your location and the type of AT you need.
2. Call
Phone the supplier. Confirm stock and price before you go anywhere.
3. Collect
Make one trip, with confidence, or none at all.
What one search saves a rural user
A worked example from Siabuwa, Zimbabwe. One search replaced one trip to town. Route distances are verified and fares are sourced.
- Return travel: bus fare and local transportUS$42
- Bed and meals, two to three days awayUS$60
- Lost income or carer time, three daysUS$15
- Cost avoided per tripUS$117
- Cost of one AT-Info-Map search (data bundle)US$2
- Net saving per user, per searchUS$115
Source: SAFOD, AT-Info-Map ROI Case Study, 2026.
Slide to see the savings
Zimbabwe users saved more than the whole grant
By December 2022, AT-Info-Map had 6,868 users in Zimbabwe. At US$115 saved per search, that avoided US$789,820 in costs.
The grant of US$717,728 built the platform for all ten countries. So Zimbabwe alone paid it back, with a net benefit of US$72,092. That is a return of about 10%.
Financial ROI: Zimbabwe-only user savings against the full regional grant
The social return: better assistive technology access
A school fee paid
A saved US$115 was rarely just money. It paid fees and kept a day of work.
One call, not a long trip
In remote Siabuwa, one phone call replaced a full day on rough roads.
Freedom and dignity
People sourced hearing aids, crutches, wheelchairs and ramps without waiting on others to arrange a costly trip.
Free reach for suppliers
Listing was free. Suppliers reached buyers beyond their town and country, including government and hospital buyers.
Why AT-Info-Map went offline
The grant paid for the build and the launch. It did not pay for what came after.
Built and launched
App, web database and supplier map go live in ten countries.
No budget to run it
Nothing was set aside for servers, app store accounts or tech support.
Kept alive on goodwill
SAFOD kept the app listed with stretched staff.
Support ran out
Not a tech failure. A gap in the project design.
The plan to restore assistive technology access
Two phases. First, bring the app back online. Then build the income that keeps it running.
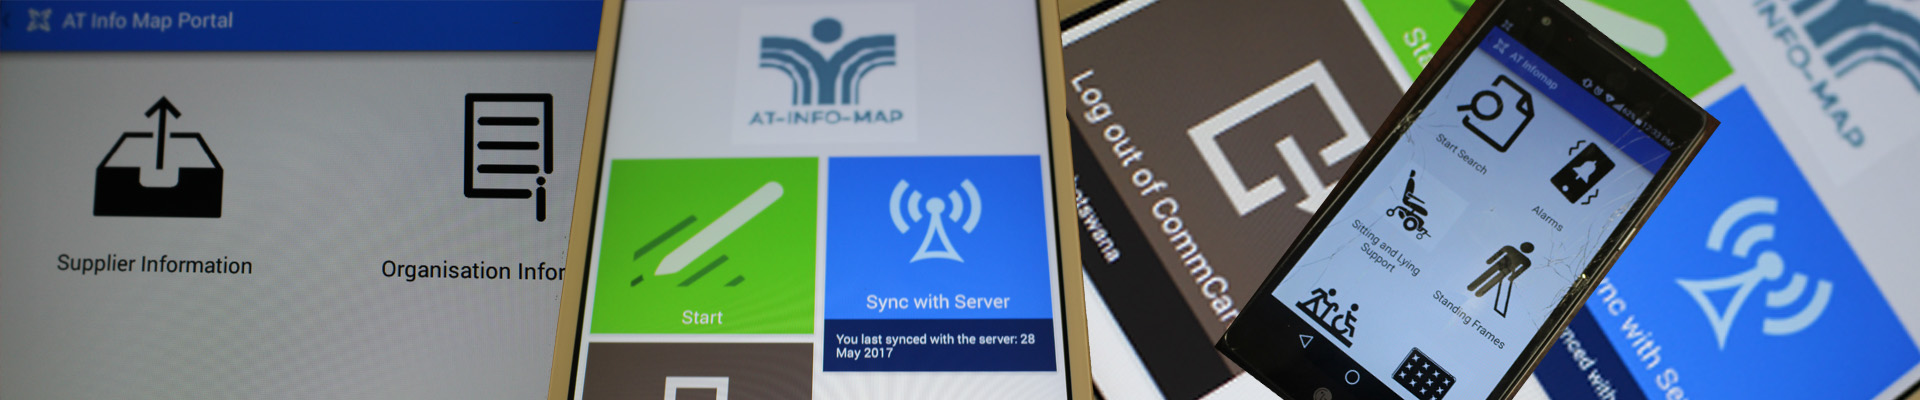
Phase 1 restores assistive technology access with both apps
The cost comes from a formal ICTech Computer Solutions quotation (August 2026). Restoring both apps together keeps the cost close to the price of one.
Value for money: US$2,145 is about 0.3% of the original grant. It reactivates a platform that saved Zimbabwean users over US$789,820.
| Item | US$ |
|---|---|
| Android app restoration and redeployment (includes Google Play hosting) | 1,035 |
| iOS app restoration and redeployment (includes Apple Developer Program) | 1,110 |
| Web database restoration | Included |
| Total: both platforms restored together | 2,145 |
Phase 2 builds an income so the app pays its own way
Two changes make this possible: ads in the app, and paid listing tiers. The free tier stays free for every current listing.
Free
- Name, category, location, phone.
- Photos.
- Exact prices.
- Top of search.
Standard
- Name, category, location, phone.
- Product or service photos.
- Exact prices, editable any time.
- Top of search.
Premium
- Name, category, location, phone.
- Product or service photos.
- Exact prices, editable any time.
- Top-of-search placement.
Buyers can compare prices without phoning every supplier. Most of the money goes straight into marketing the Android app, the iOS app and the web database.
The path to a self-financing app
Marketing should grow paid listings and advertiser demand over the first six months. The chart sets monthly income against a running cost of about US$1,500. That covers hosting, app store fees and a part-time technical and moderation retainer.
Month 6
Break-even: US$1,780 income, a US$280 surplus.
Month 12
US$2,596 income, a US$1,096 surplus.
Year one income should reach about US$18,495. At the same pace, it repays the full US$25,000 Phase 2 investment by around month 15. After that, SAFOD plans to reinvest the surplus in marketing and country-level growth.
These are planning estimates. SAFOD will review them against real listing and advertiser uptake once Phase 2 starts.
Projected path to self-financing: monthly income against running cost
Give to bring back assistive technology access
This request funds a small project with a proven record, a clear lesson and a costed plan to make sure assistive technology access is never lost again.
| Phase | Purpose | US$ |
|---|---|---|
| 1 | Restore the Android app, iOS app and web database. | 2,145 |
| 2 | Six months of features, marketing and management, to self-financing. | 25,000 |
| Total: full revival on a lasting footing | 27,145 | |
- A proven platform: 6,868 Zimbabwean users by December 2022.
- A costed plan with a formal quotation.
- Free listings stay free for suppliers.
- A path to cover its own running costs by month 6.
Your questions, answered
How will my gift be used?
Phase 1 (US$2,145) restores the Android app, the iOS app and the web database. Phase 2 (US$25,000) funds features, marketing and management for six months. Of Phase 2, 64% goes to marketing.
Why is AT-Info-Map offline?
The original grant paid for the build and launch only. No budget was set aside for servers, app store accounts or tech support. This plan fixes that gap.
Will suppliers still list for free?
Yes. All current free listings keep their free status. Paid Standard and Premium tiers add photos, exact prices and top-of-search placement.
Is it safe to donate here?
Your gift is handled on PayPal's secure page. SAFOD never sees or stores your card details.
Can I give any amount?
Yes. Any gift from US$5 helps. Choose a preset or type your own amount in the form.
Help restore assistive technology access today
One small gift restores a channel that cut cost, time and hardship for people with disabilities.
Donate nowContact
AT-Info-Map Admin, Southern Africa Federation of the Disabled (SAFOD), Gaborone, Botswana.